Course Overview
Starting on Monday, December 16th, 2024
In a world driven by data, the ability to transform raw information into compelling visuals is a critical skill. Data visualization bridges the gap between analysis and communication, turning complex data into clear, actionable insights. This course is designed to equip you with the expertise to create impactful visual narratives, enabling you to convey ideas effectively across diverse audiences.
Learning Outcomes
Gain proficiency in Python’s leading visualization tools, including matplotlib, seaborn, plotly, altair, folium, and networkx, enabling versatile and efficient chart creation.
Learn to structure data visuals by combining aesthetics, data, and geometry for polished and meaningful designs.
Develop the ability to present complex data clearly, making it accessible and actionable for diverse audiences.
Schedule
| START DATE | MONDAY, DECEMBER 16th, 2024 |
|---|---|
| Periodicity | Meet Monday to Thursday for 4 evenings |
| Schedule | From 7 PM to 9 PM PST |
| Session Location | Zoom (Supportvectors facility is also available for attendance) |
| Session Type | Evening interactive Zoom sessions |
Prerequisites

Syllabus details
 |
 |
This immersive course is designed to help you master the art of data visualization using Python. From foundational techniques to advanced visual storytelling, you’ll learn to create a variety of compelling visualizations that reveal insights and captivate audiences. Using popular Python libraries like matplotlib, seaborn, plotly, altair, folium, and networkx, you’ll build skills to visualize data in diverse forms—line charts, scatter plots, bar charts, maps, and network graphs.
Each session will combine theory with hands-on practice, guiding you step-by-step to create interactive and dynamic visualizations.
By the end of the course, you’ll be equipped with the knowledge and tools to transform raw data into powerful visual stories, ready for professional analysis, reports, and presentations.
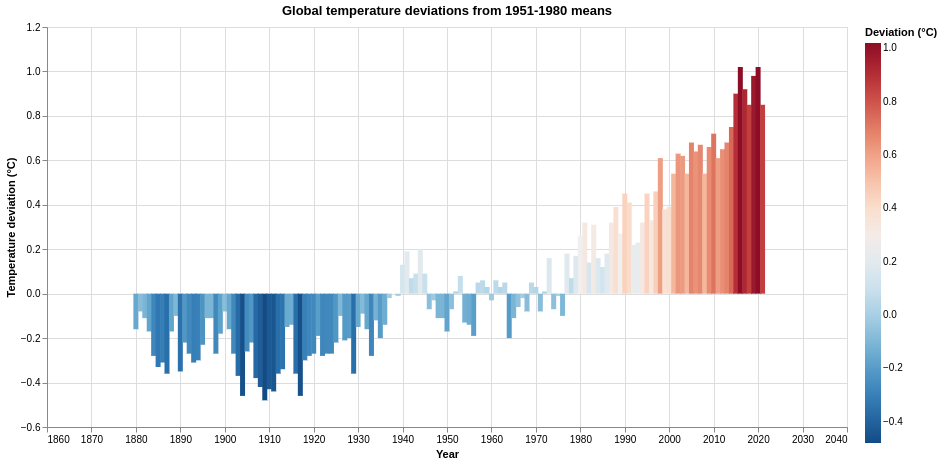
We will get started by setting up your environment to work with Python’s powerful visualization libraries. We will also dive into the importance of data visualization in making data insights clearer and more accessible. We will learn to create line plots using several popular libraries. Towards the end of the day, we’ll apply these skills to recreate the Global Temperature Deviations plot—also known as the Warming Stripes visualization—by modifying a basic line plot to represent global temperature trends over time.

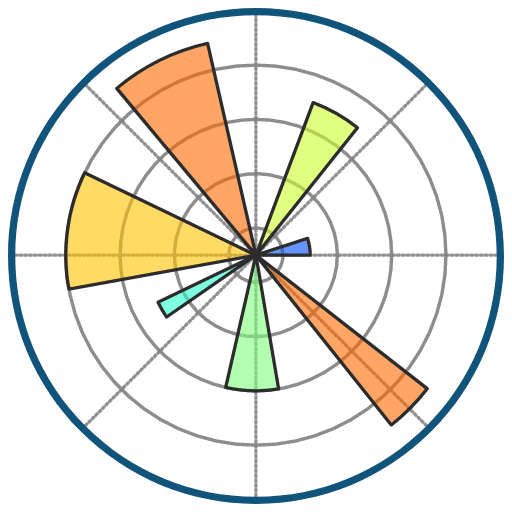
This session focuses on bar charts, one of the most versatile tools for comparing data. You’ll begin with simple bar charts and progress to creating multibars and proportional bar charts. We’ll then introduce polar charts, which offer a unique way to display circular data. To end the day, you’ll recreate Florence Nightingale’s iconic Two Roses – “Diagram of the Causes of Mortality,” combining historical inspiration with modern tools.

This session is all about scatter plots, a fundamental tool for exploring relationships between variables. You’ll learn to create scatter plots and use properties like size, color, and scale to convey additional visual information. Finally, you’ll apply these skills to recreate the dynamic and interactive “Wealth of Nations” bubble chart in a Python notebook, bringing data to life with movement and depth.
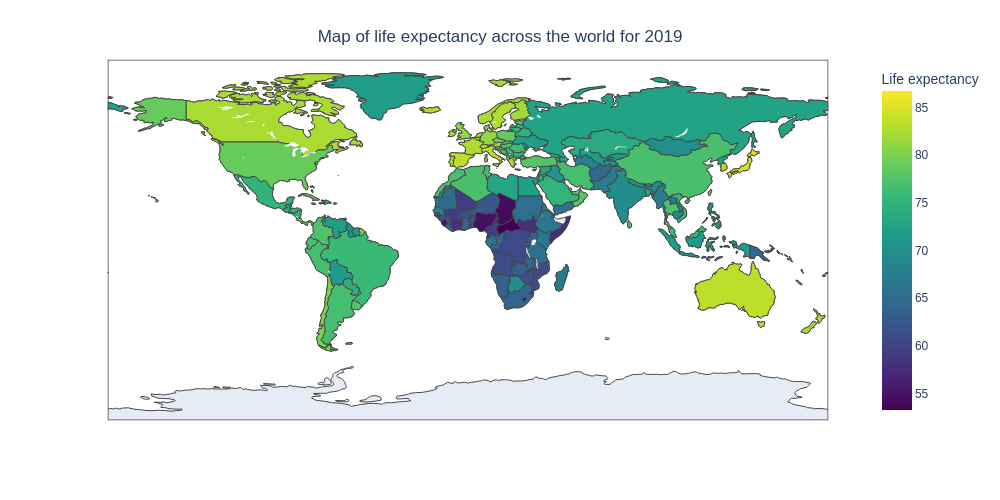
This session dives into visualizing data in geographical and network contexts. You’ll learn to use Folium to create interactive map visualizations and plot geographic data effectively. Next, you’ll explore choropleth maps to represent data across regions. We’ll then shift focus to plotting graphical data, learning to create stunning network visualizations using networkx and PyVis. The day concludes with an interactive session to discuss insights and applications.
Target Audience
Teaching Faculty

Asif Qamar
Chief Scientist and Educator
Background
Over more than three decades, Asif’s career has spanned two parallel tracks: as a deeply technical architect & vice president and as a passionate educator. While he primarily spends his time technically leading research and development efforts, he finds expression for his love of teaching in the courses he offers. Through this, he aims to mentor and cultivate the next generation of great AI leaders, engineers, data scientists & technical craftsmen.
Educator
He has also been an educator, teaching various subjects in AI/machine learning, computer science, and Physics for the last 32 years. He has taught at the University of California, Berkeley extension, the University of Illinois, Urbana-Champaign (UIUC), and Syracuse University. He has also given a large number of courses, seminars, and talks at technical workplaces. He has been honored with various excellence in teaching awards in universities and technical workplaces.

Chandar Lakshminarayan
Head of AI Engineering
Background
A career spanning 25+ years in fundamental and applied research, application development and maintenance, service delivery management and product development. Passionate about building products that leverage AI/ML. This has been the focus of his work for the last decade. He also has a background in computer vision for industry manufacturing, where he innovated many novel algorithms for high precision measurements of engineering components. Furthermore, he has done innovative algorithmic work in robotics, motion control and CNC.
Educator
He has also been an educator, teaching various subjects in AI/machine learning, computer science, and Physics for the last decade.

Krishnan Ramaswamy
Co-Instructor
Background
Krishnan Ramaswamy is an engineering leader, AI practitioner, and educator with an M.S. in Computer Science and Engineering and more than 25 years of industry experience. Throughout his career, he has designed and delivered large-scale platforms, enterprise applications, and AI/ML-driven solutions across Collaboration, Security, and Customer Experience domains. His expertise includes AI engineering, large language models, retrieval systems, agent architectures, distributed systems, and enterprise platform development. He is passionate about transforming emerging research into production-ready solutions that deliver measurable business value.
Educator
As a co-instructor at SupportVectors, Krishnan mentors engineers and technology professionals on modern AI engineering practices, helping them understand not only how AI systems are built, but also how they can be deployed, evaluated, governed, and scaled in enterprise environments. His teaching combines deep technical knowledge with real-world experience gained from decades of building and leading engineering initiatives.
Teaching Assistants
Our teaching assistants will guide you through your labs and projects. Whenever you need help or clarification, contact them on the SupportVectors Discord server or set up a Zoom meeting.

Kate Amon
Univ. of California, Berkeley

Shubeeksh K
MS Ramaiah Institute of Technology

Purnendu Prabhat
Kalasalingam Univ.

Harini Datla
Indian Statistical Institute

Kunal Lall
Univ. of Illinois, Chicago
In-Person vs Remote Participation
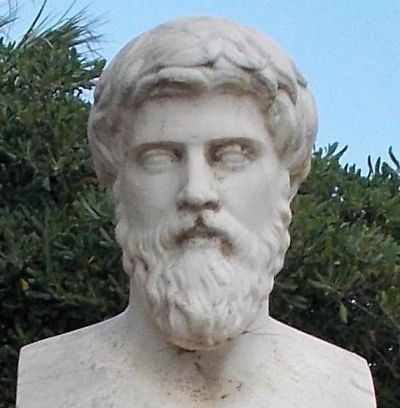
Plutarch
Education is not the filling of a pail, but the lighting of a fire. “For the mind does not require filling like a bottle, but rather, like wood, it only requires kindling to create in it an impulse to think independently and an ardent desire for the truth.
Our Goal: build the next generation of data scientists and AI engineers
The AI revolution is perhaps the most transformative period in our world. As data science and AI increasingly permeate the fabric of our lives, there arises a need for deeply trained scientists and engineers who can be a part of the revolution.
Over 2250+ AI engineers and data scientists trained
- Instructors with over three decades of teaching excellence and experience at leading universities.
- Deeply technical architects and AI engineers with a track record of excellence.
- More than 30 workshops and courses are offered
- This is a state-of-the-art facility with over a thousand square feet of white-boarding space and over ten student discussion rooms, each equipped with state-of-the-art audio-video.
- 20+ research internships finished.
Where technical excellence meets a passion for teaching
There is no dearth of technical genius in the world; likewise, many are willing and engaged in teaching. However, it is relatively rare to find someone who has years of technical excellence, proven leadership in the field, and who is also a passionate and well-loved teacher.
SupportVectors is a gathering of such technical minds whose courses are a crucible for in-depth technical mastery in this very exciting field of AI and data science.
A personalized learning experience to motivate and inspire you
Our teaching faculty will work closely with you to help you make progress through the courses. Besides the lecture sessions and lab work, we provide unlimited one-on-one sessions to the course participants, community discussion groups, a social learning environment in our state-of-the-art facility, career guidance, interview preparation, and access to our network of SupportVectors alumni.
Join over 2000 professionals who have developed expertise in AI/ML
Become Part of SupportVectors to Inculcate In-depth Technical Abilities and Further Your Career.

