STARTS SOON ON MONDAY, DECEMBER 16th, 2024!
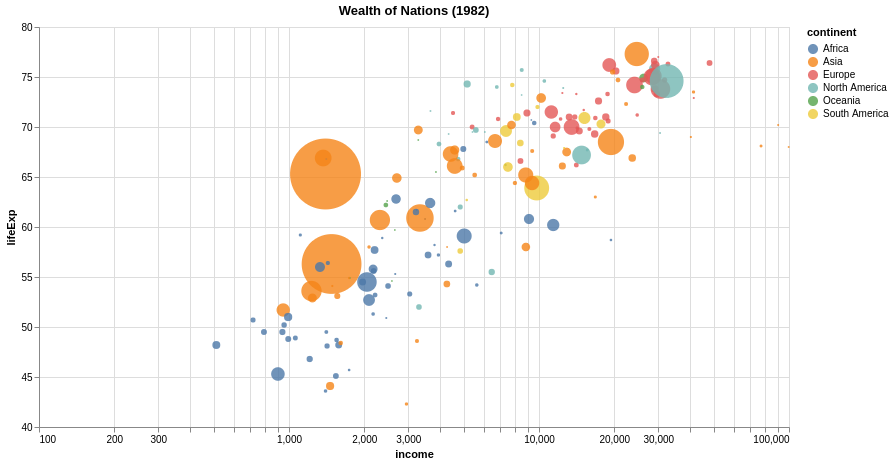
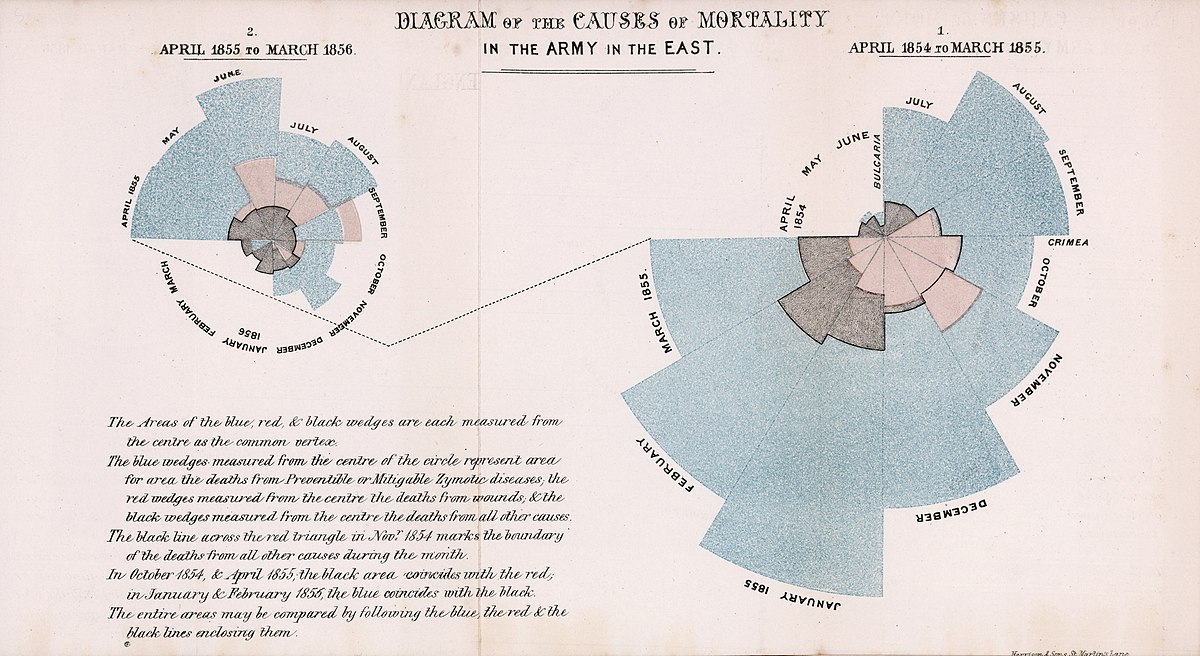
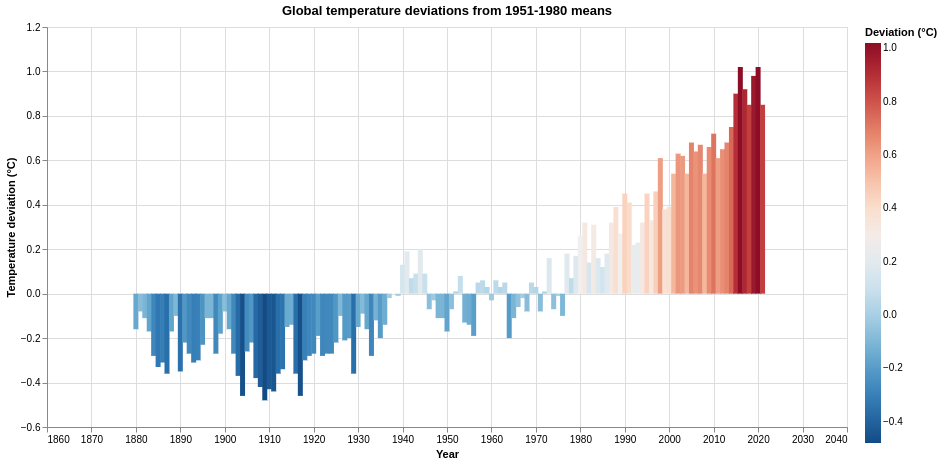
This course covers essential techniques for creating insightful visualizations using Python. Over four days, you’ll learn to use libraries like matplotlib, seaborn, plotly, altair, folium, and networkx to create line charts, bar charts, scatter plots, maps, and network graphs. You’ll also dive into advanced topics like interactive visualizations, the Grammar of Graphics, and recreating iconic visualizations. Hands-on labs and assignments ensure you practice each concept, preparing you to transform data into compelling visual stories for real-world applications.




Reviews
There are no reviews yet.